Tag Archives: Microsoft Graph

New module EasyGraph for accessing Microsoft Graph from PowerShell

Microsoft Graph has been an increasingly important tool when working with automation tasks. With its many APIs, Graph has become a gem in the automation toolbox, with one single interface to interact with all sort of data.

To simplify access to Microsoft Graph, I have written a PowerShell module, EasyGraph. The module provides a simple way of connecting and querying Microsoft Graph, in a similar way as for example the AzureAD module. The module works cross-platform and the source code is available on GitHub. It is installed directly from PowerShell Gallery:

Install-Module -Name EasyGraph

The EasyGraph module allows several different types of authentication, both interactive and silent, purposed for automation and background jobs.

  • Certificate based authentication with thumbprint (Windows only)
  • Certificate based authentication with Pfx file
  • Username and password (Windows only)
  • Client credentials
  • Device Code

You also need to register an application in the Azure portal in order to use the module.  In the application you also have to delegate the permissions needed for your script.

Detailed information about the module is available in the EasyGraph repository on GitHub. Below is a simple example on how we for example could update some user attributes of all users in AzureAD.

# Load the module
Import-Module -Name EasyGraph

# We need the ClientId/AppId from the App you created in AzureAD
$MyApp = 'a72b9508-6cbc-4117-b6d7-ff69cf248290'

# Connect using the username+password method
Connect-EasyGraph -AppId $MyApp

# Define whe attributes we want to update
$NewAttributes = @{
    city       = 'Stockholm'
    postalCode = '11130'
}

# Get all users and loop through them
Invoke-EasyGraphRequest -Resource '/users' | Foreach-Object {
    # For each user, get the id ($_.id) and call Graph to set the new attributes
    Invoke-EasyGraphRequest -Resource "/users/$($_.id)" -Method PATCH -Body $NewAttributes
}

# All done, disconnect
Disconnect-EasyGraph

With this simple example it is now up to you to come up with the next big thing, that unleash the power of Microsoft Graph. Happy coding!

/ Andreas

Create simple PowerBI reports for Intune through the Microsoft Graph

Reporting, playing with data and creating all kinds of charts is always fun. PowerBI is probably the simplest playground doing it.

While doing an O365 / EMS project, management wanted a simple dashboard to keep track of different KPI’s in the project. Example on the data they wanted was number of onboarded users to Exchange Online and enrolled devices in Intune. The Office 365 adoption content pack is in preview and provides lots of insights to how the services are used (in some cases, maybe too much)… In this specific case, we also had an Intune Cloud Only environment, so our reporting as well as delegation possibilites were very limited.

2017-01-03_13-34-12

Luckily enough, some Intune data (and its growing and growing) are nowdays exposed through the Microsoft Graph for us to consume with PowerBI directly with REST and OData.

In my example, I will simply get all registered devices to create my report. To find what possibilites there are, look in to the Microsoft Graph Documentation. If you want to use query parameters, you’ll find the supported ones here.

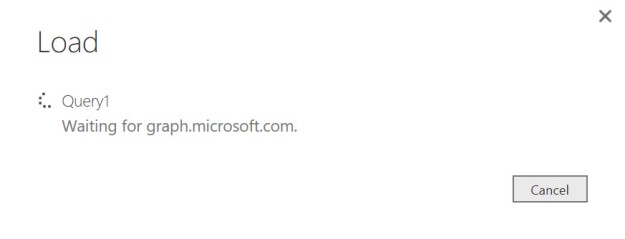
1. First connect and load the OData feed from Microsoft Graph. In my case I am using the https://graph.microsoft.com/v1.0/devices endpoint. Sign in with an organizational account or app that have appropriate permissions.
2017-01-03_14-36-01

2017-01-03_14-45-102017-01-03_14-45-30
2017-01-03_14-50-39 2017-01-03_14-50-55

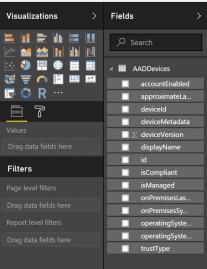
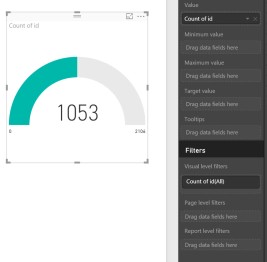
2. After the data has been loaded successfully in to PowerBI it’s time to create som nice charts!
2017-01-03_14-54-28
2017-01-03_14-56-41
2017-01-03_14-57-46


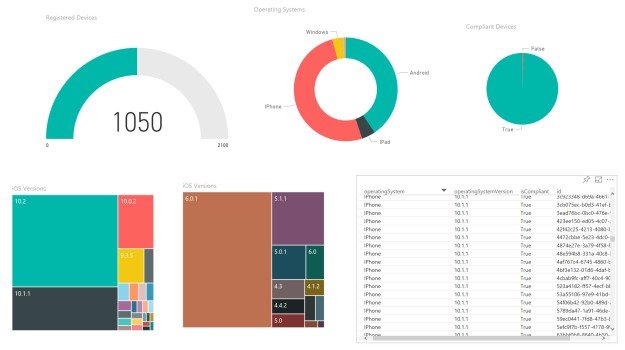
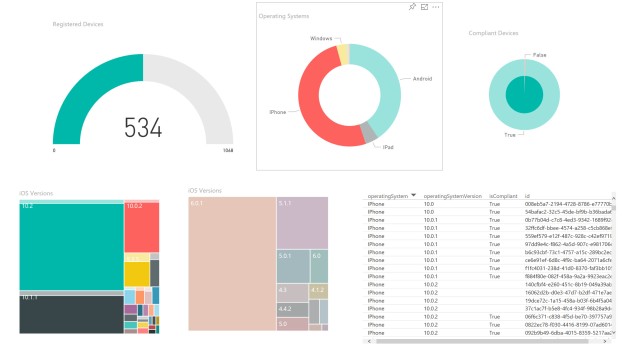
Result – My “finished” basic report

2017-01-03_15-06-09
2017-01-03_15-06-30

This was a simple example how to get started with PowerBI and the Microsoft Graph – hopefully you’ve now got some inspiration on what possibilites there are with just five minutes effort. Imagine what you could do if you really put in some time. 🙂

Happy reporting!

/Johan